Plots probability distribution function of stock-recruit steepness
Source:R/report_auxiliary.R
plot_steepness.RdPlots the probability distribution function of steepness from the mean and standard deviation.
Usage
plot_steepness(
  m,
  sd,
  is_transform = FALSE,
  SR = c("BH", "Ricker"),
  color = "black"
)
Arguments
- m
The mean of the distribution (vectorized).
- sd
The standard deviation of the distribution (vectorized).
- is_transform
Logical, whether the mean and standard deviation are in normal space (FALSE) or transformed space.
- SR
The stock recruitment relationship (determines the range and, if relevant, transformation of steepness).
- color
A vector of colors.
Value
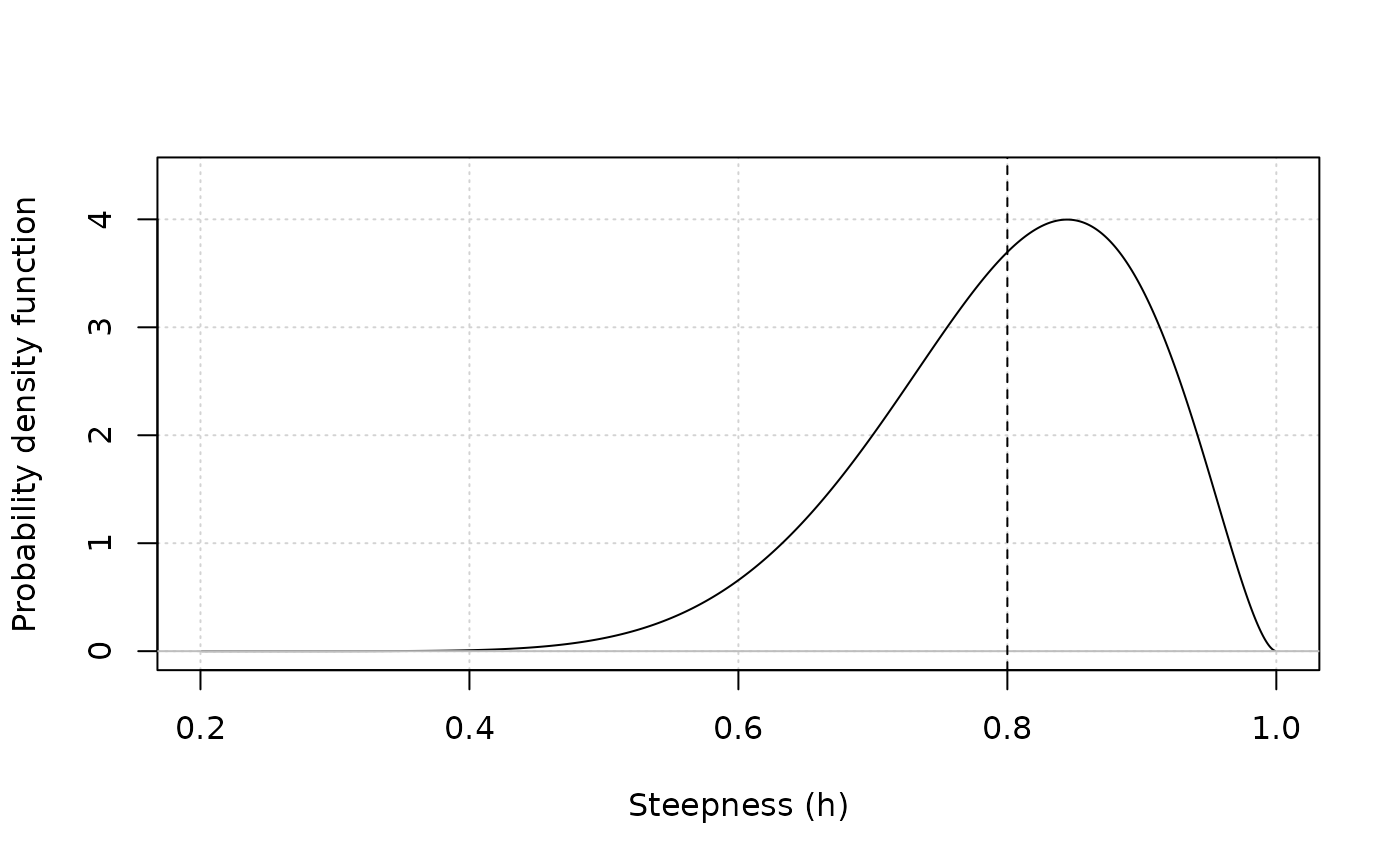
A plot of the probability distribution function. Vertical dotted line indicates mean of distribution.
Note
The function samples from a beta distribution with parameters alpha and beta that are converted from the mean and standard deviation. Then, the distribution is transformed from 0 - 1 to 0.2 - 1.