Plots the probability distribution function of a lognormal variable from the
mean and standard deviation in either transformed (normal) or untransformed space.
Usage
plot_lognormalvar(m, sd, label = NULL, logtransform = FALSE, color = "black")
Arguments
- m
A vector of means of the distribution.
- sd
A vector of standard deviations of the distribution.
- label
Name of the variable to be used as x-axis label.
- logtransform
Indicates whether the mean and standard deviation are in
lognormal (TRUE) or normal (FALSE) space.
- color
A vector of colors.
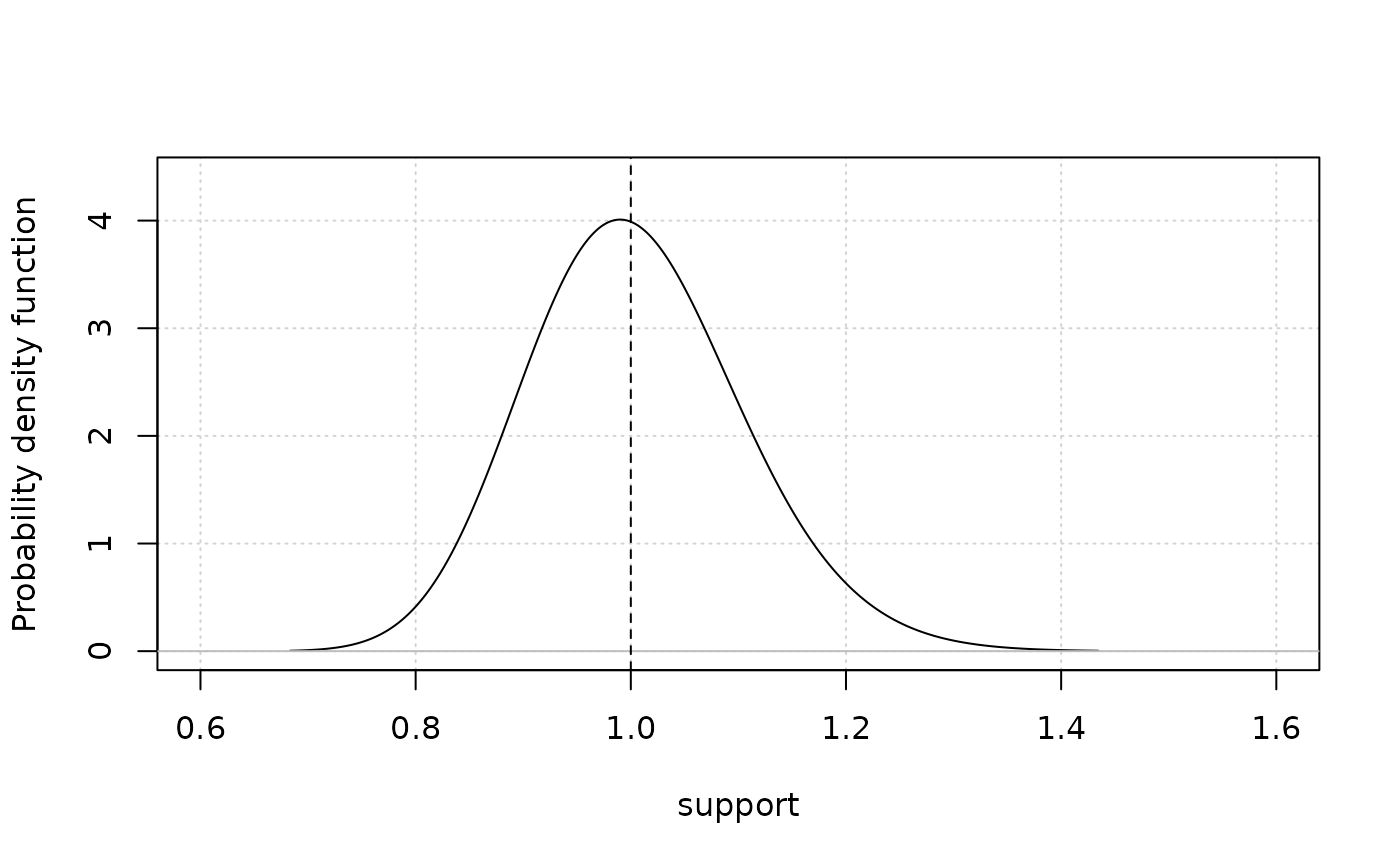
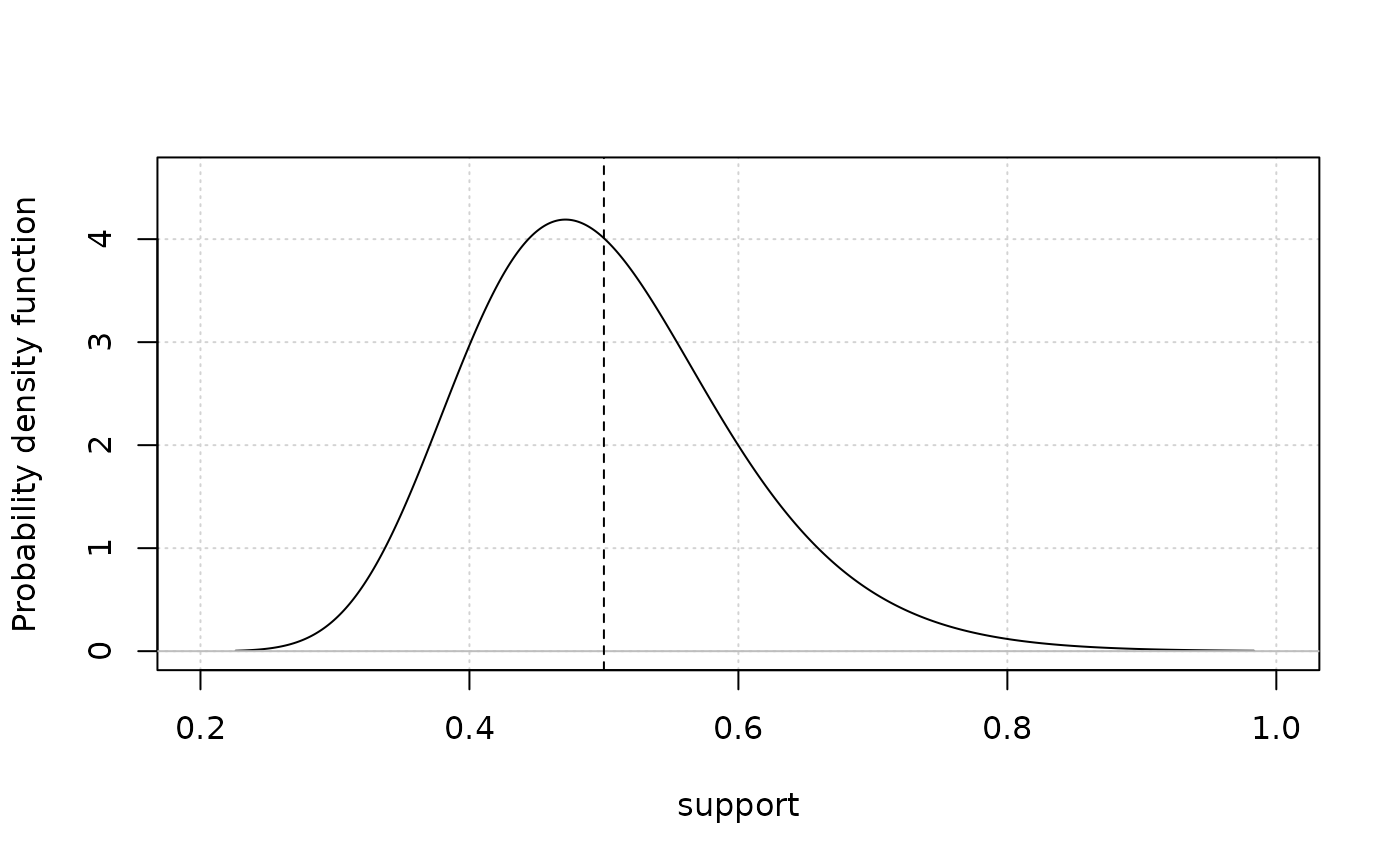
Value
A plot of the probability distribution function. Vertical dotted line
indicates mean of distribution. This function can plot multiple curves when multiple means
and standard deviations are provided.
Examples
mu <- 0.5
stddev <- 0.1
plot_lognormalvar(mu, stddev) # mean of plot should be 0.5


#logtransformed parameters
mu <- 0
stddev <- 0.1
plot_lognormalvar(mu, stddev, logtransform = TRUE) # mean of plot should be 1
#logtransformed parameters
mu <- 0
stddev <- 0.1
plot_lognormalvar(mu, stddev, logtransform = TRUE) # mean of plot should be 1