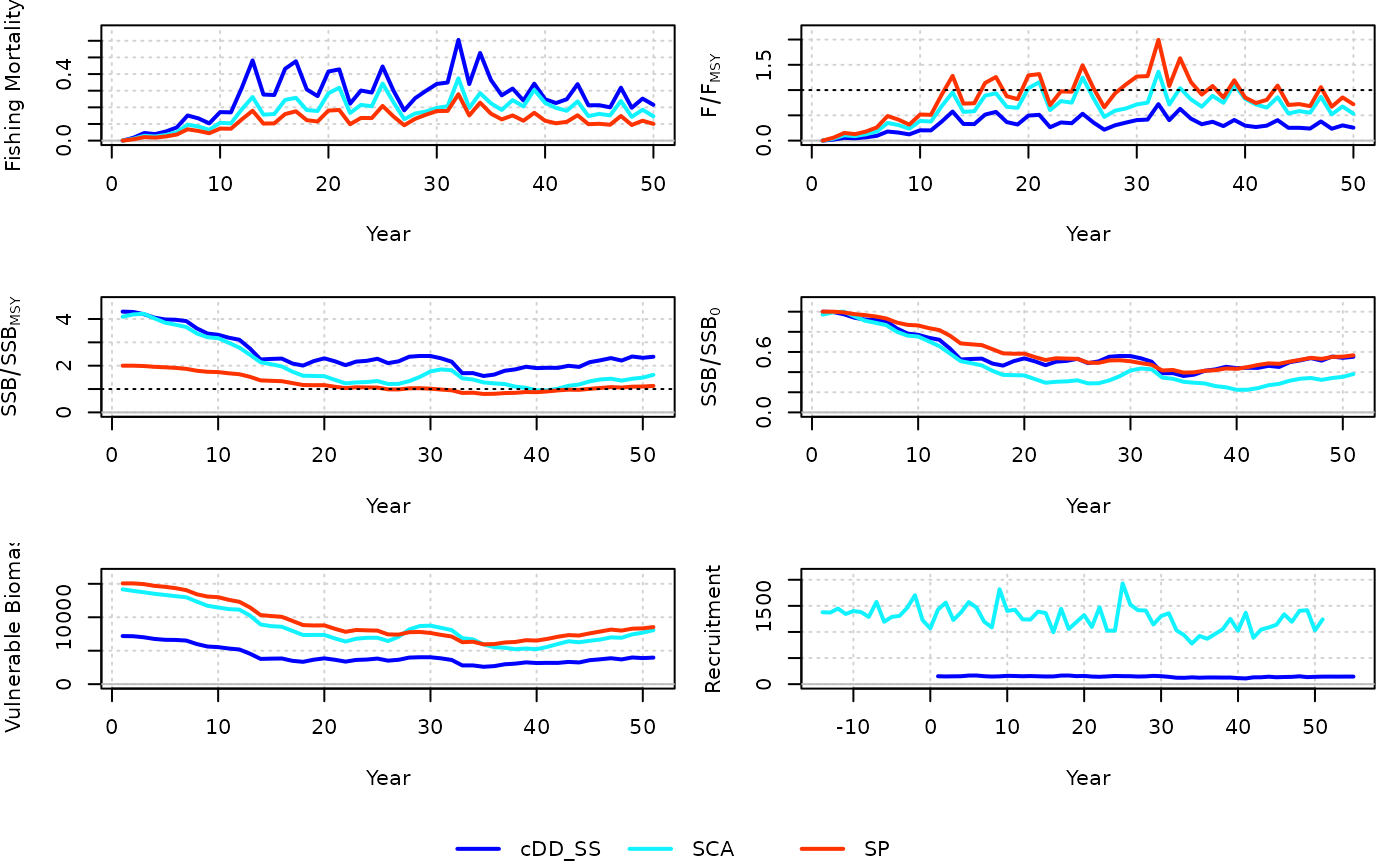
Plot biomass, recruitment, and fishing mortality time series from several . This function can be used to compare outputs among different assessment models from the same Data object.
Arguments
- ...
Objects of class Assessment.
- label
A character vector of the models for the legend.
- color
A vector of colors for each assessment model.
Examples
res <- cDD_SS(x = 3, Data = MSEtool::SimulatedData)
res2 <- SCA(x = 3, Data = MSEtool::SimulatedData)
res3 <- SP(x = 3, Data = MSEtool::SimulatedData)

compare_models(res, res2, res3)